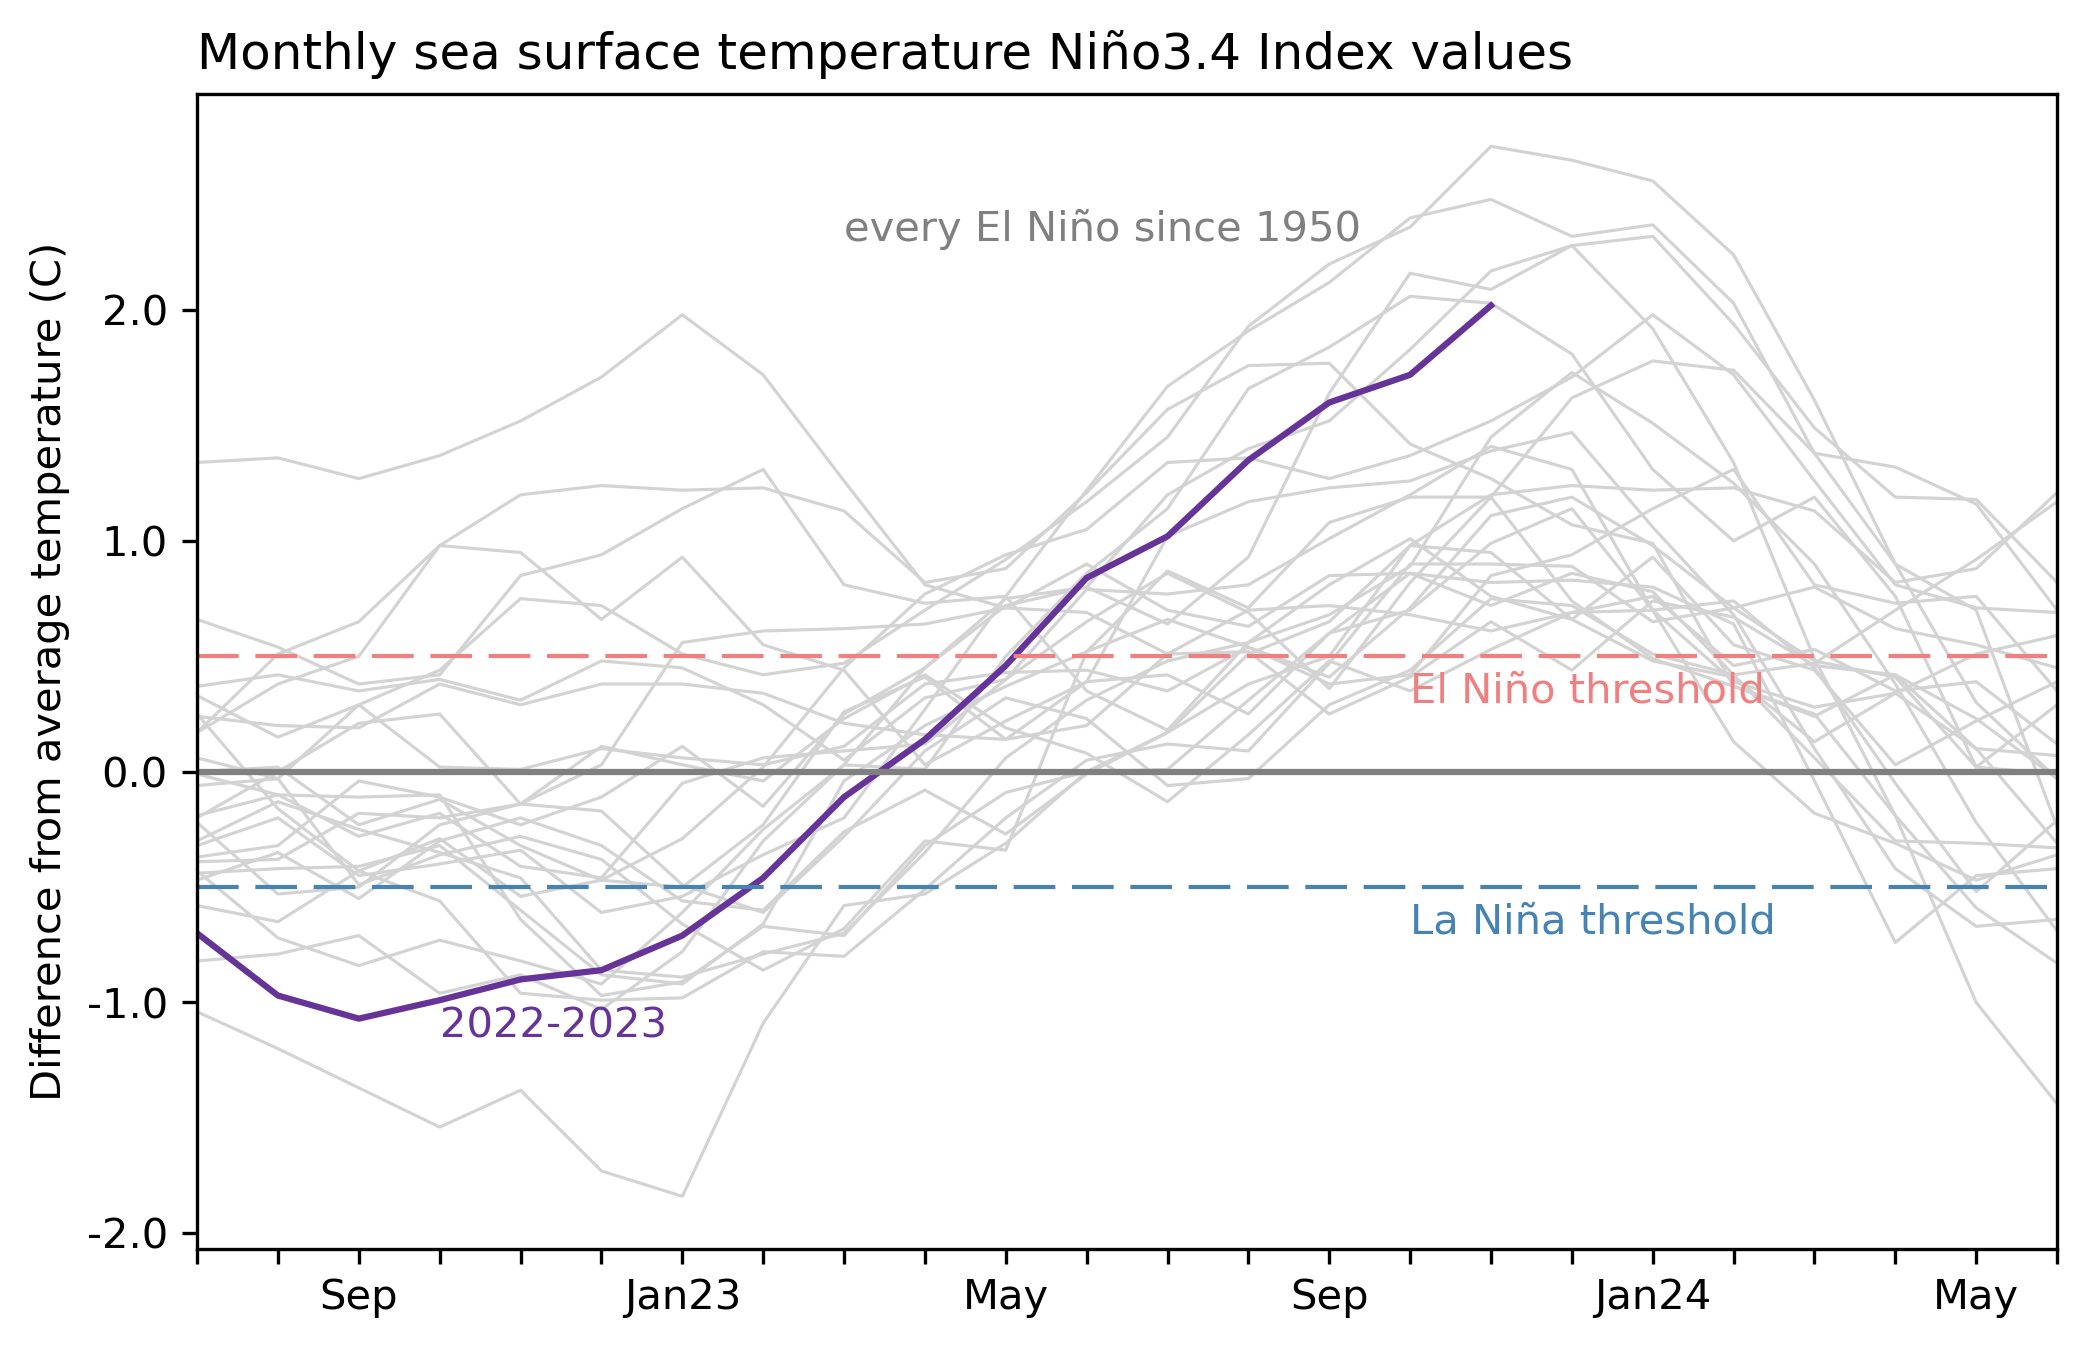
In the spring of 2023, the Pacific Ocean started heating up. After three years of cooler-than-normal sea surface temperatures, a switch had flipped, and a cascade of warming began to unfold.

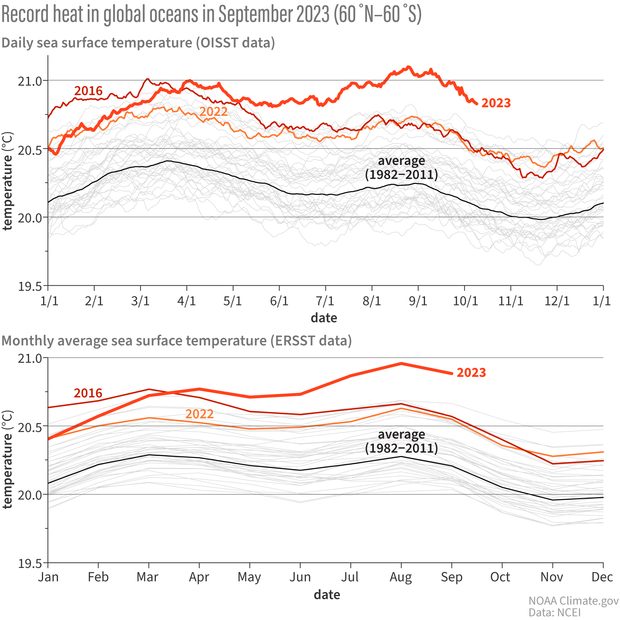
By April, the average surface temperature of the world’s oceans had broken all previous records — and still it continued to climb. Midsummer saw a plateau, followed by another surge in August and September that forced some climatologists to change the scale of their graphs entirely. The heat had quite literally gone off the charts.

The news soon spread to the general public, where headlines warned of a sudden, frightening change to the planet’s status quo. This was uncharted territory for our oceans, and nobody was quite sure how they would respond.

A graph showing Record heat in global oceans in September 2023
Global oceans experienced record-breaking heat in 2023.

But what caused this unprecedented warming, and why did it seem so abrupt?

Michael McPhaden

Michael McPhaden

Affiliate Professor, Oceanography

McPhaden is a senior scientist at NOAA’s Pacific Marine Environmental Laboratory and affiliate professor of oceanography at the University of Washington. He studies large-scale ocean dynamics, ocean-atmosphere interactions and the ocean’s role in climate.
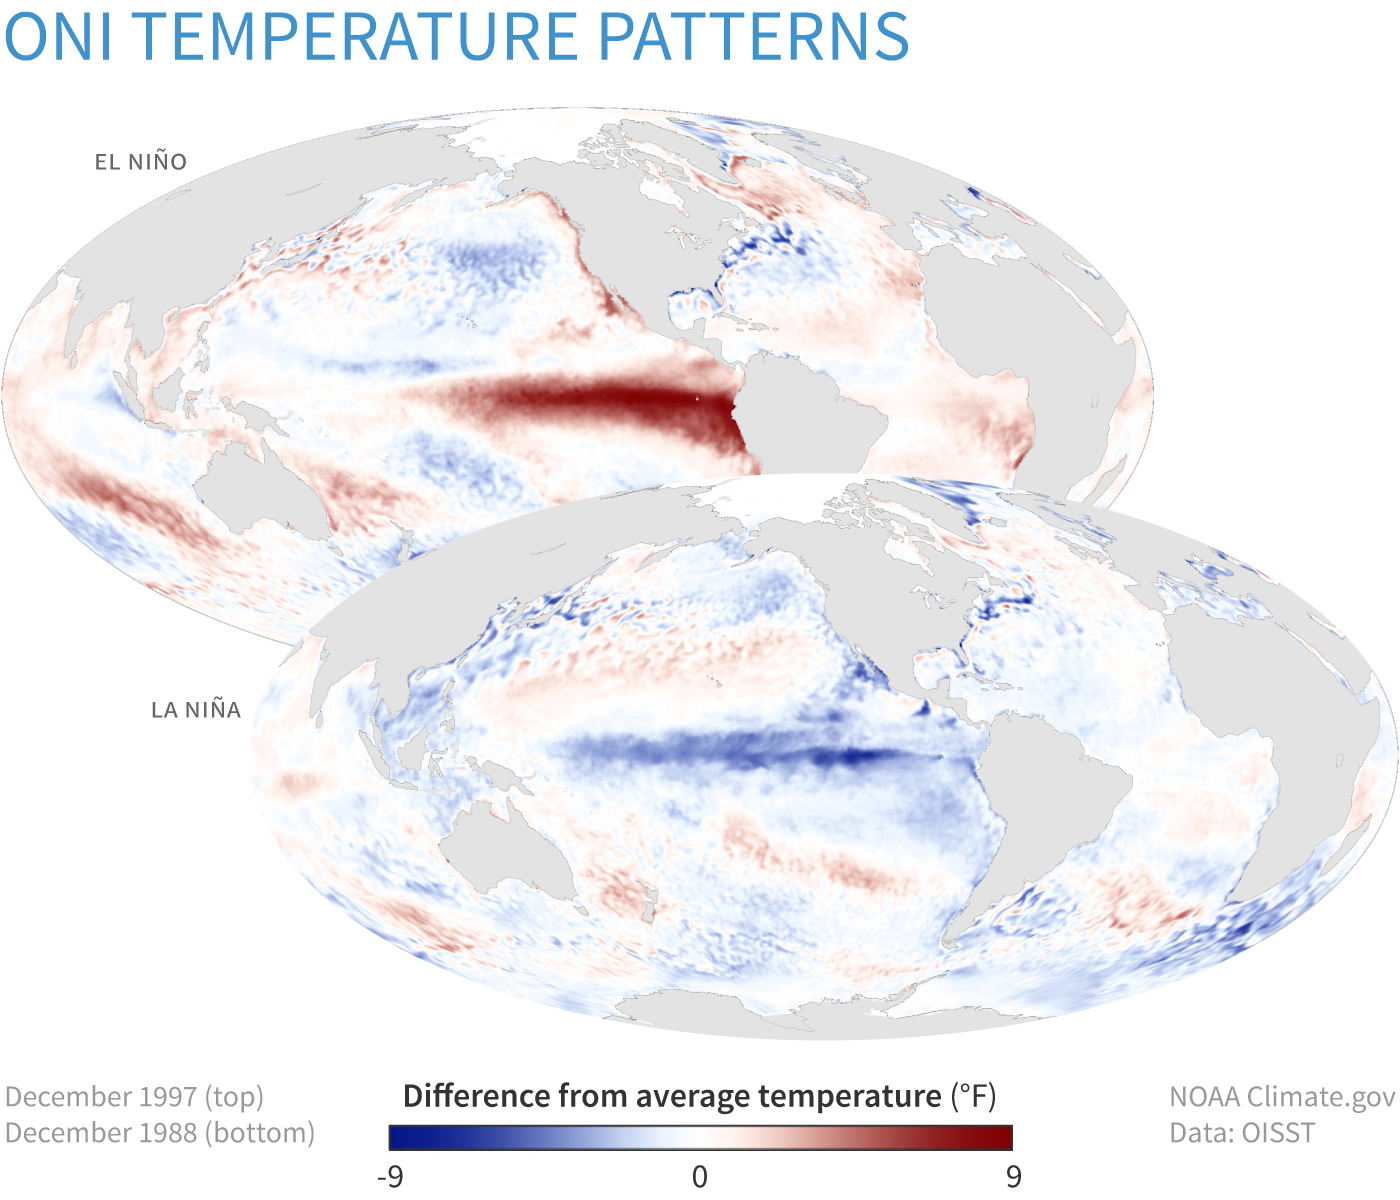
Learn more

“The main culprit is El Niño,” said Michael McPhaden, senior scientist at the National Oceanic and Atmospheric Administration’s Pacific Marine Environmental Laboratory and affiliate professor of oceanography at the University of Washington. “For the previous three years, we had La Niña conditions that sucked heat out of the atmosphere and stored it below the ocean’s surface, masking the effects of rising greenhouse gas concentrations. With the current El Niño, that heat has come back out of the ocean to be redistributed around the globe and warm the whole planet.”

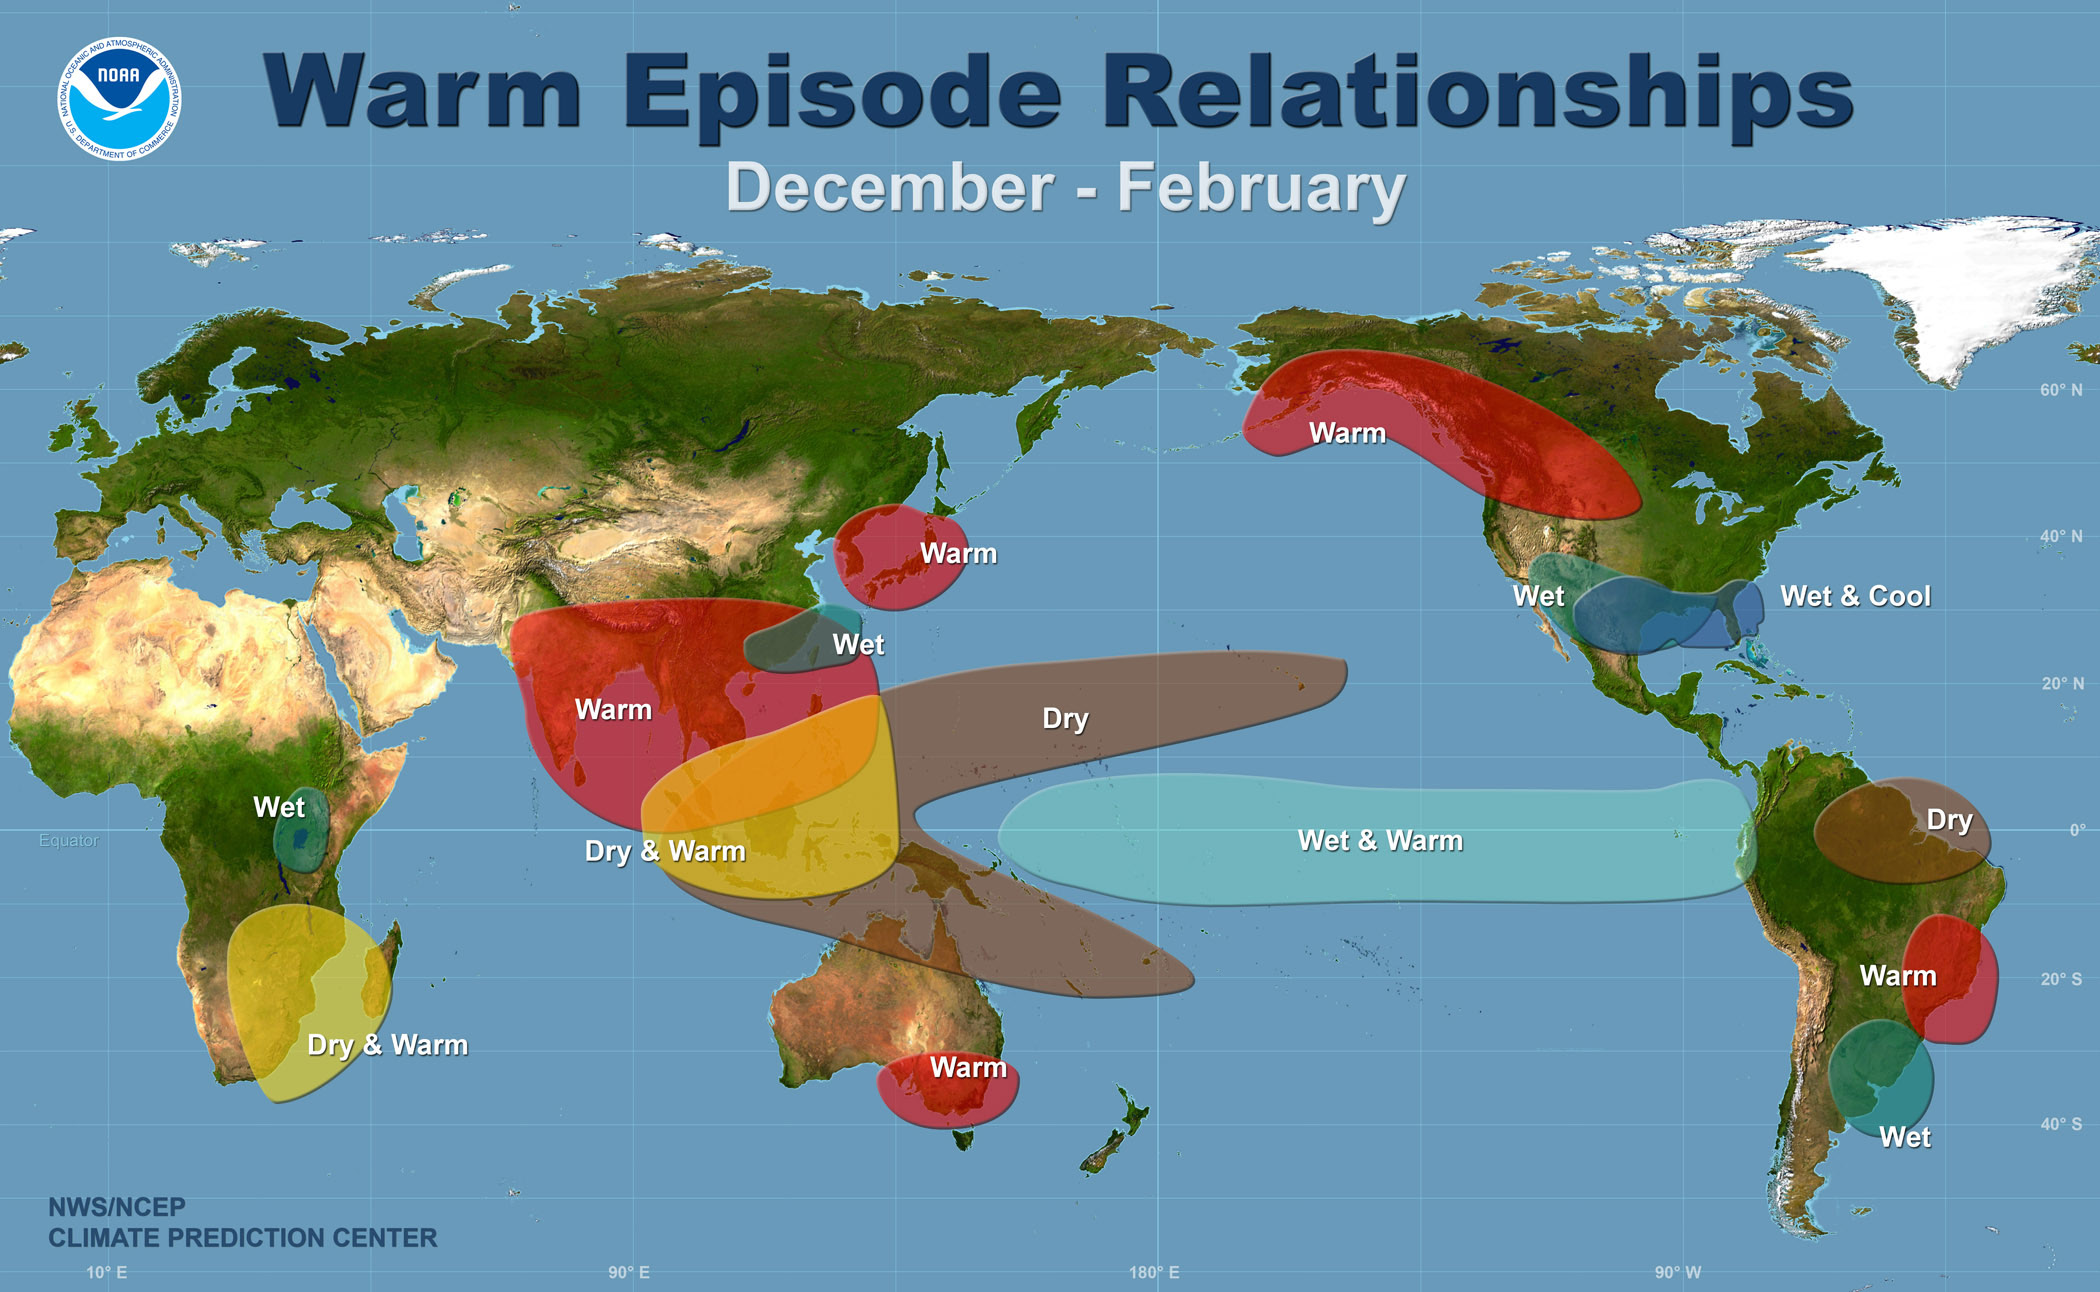
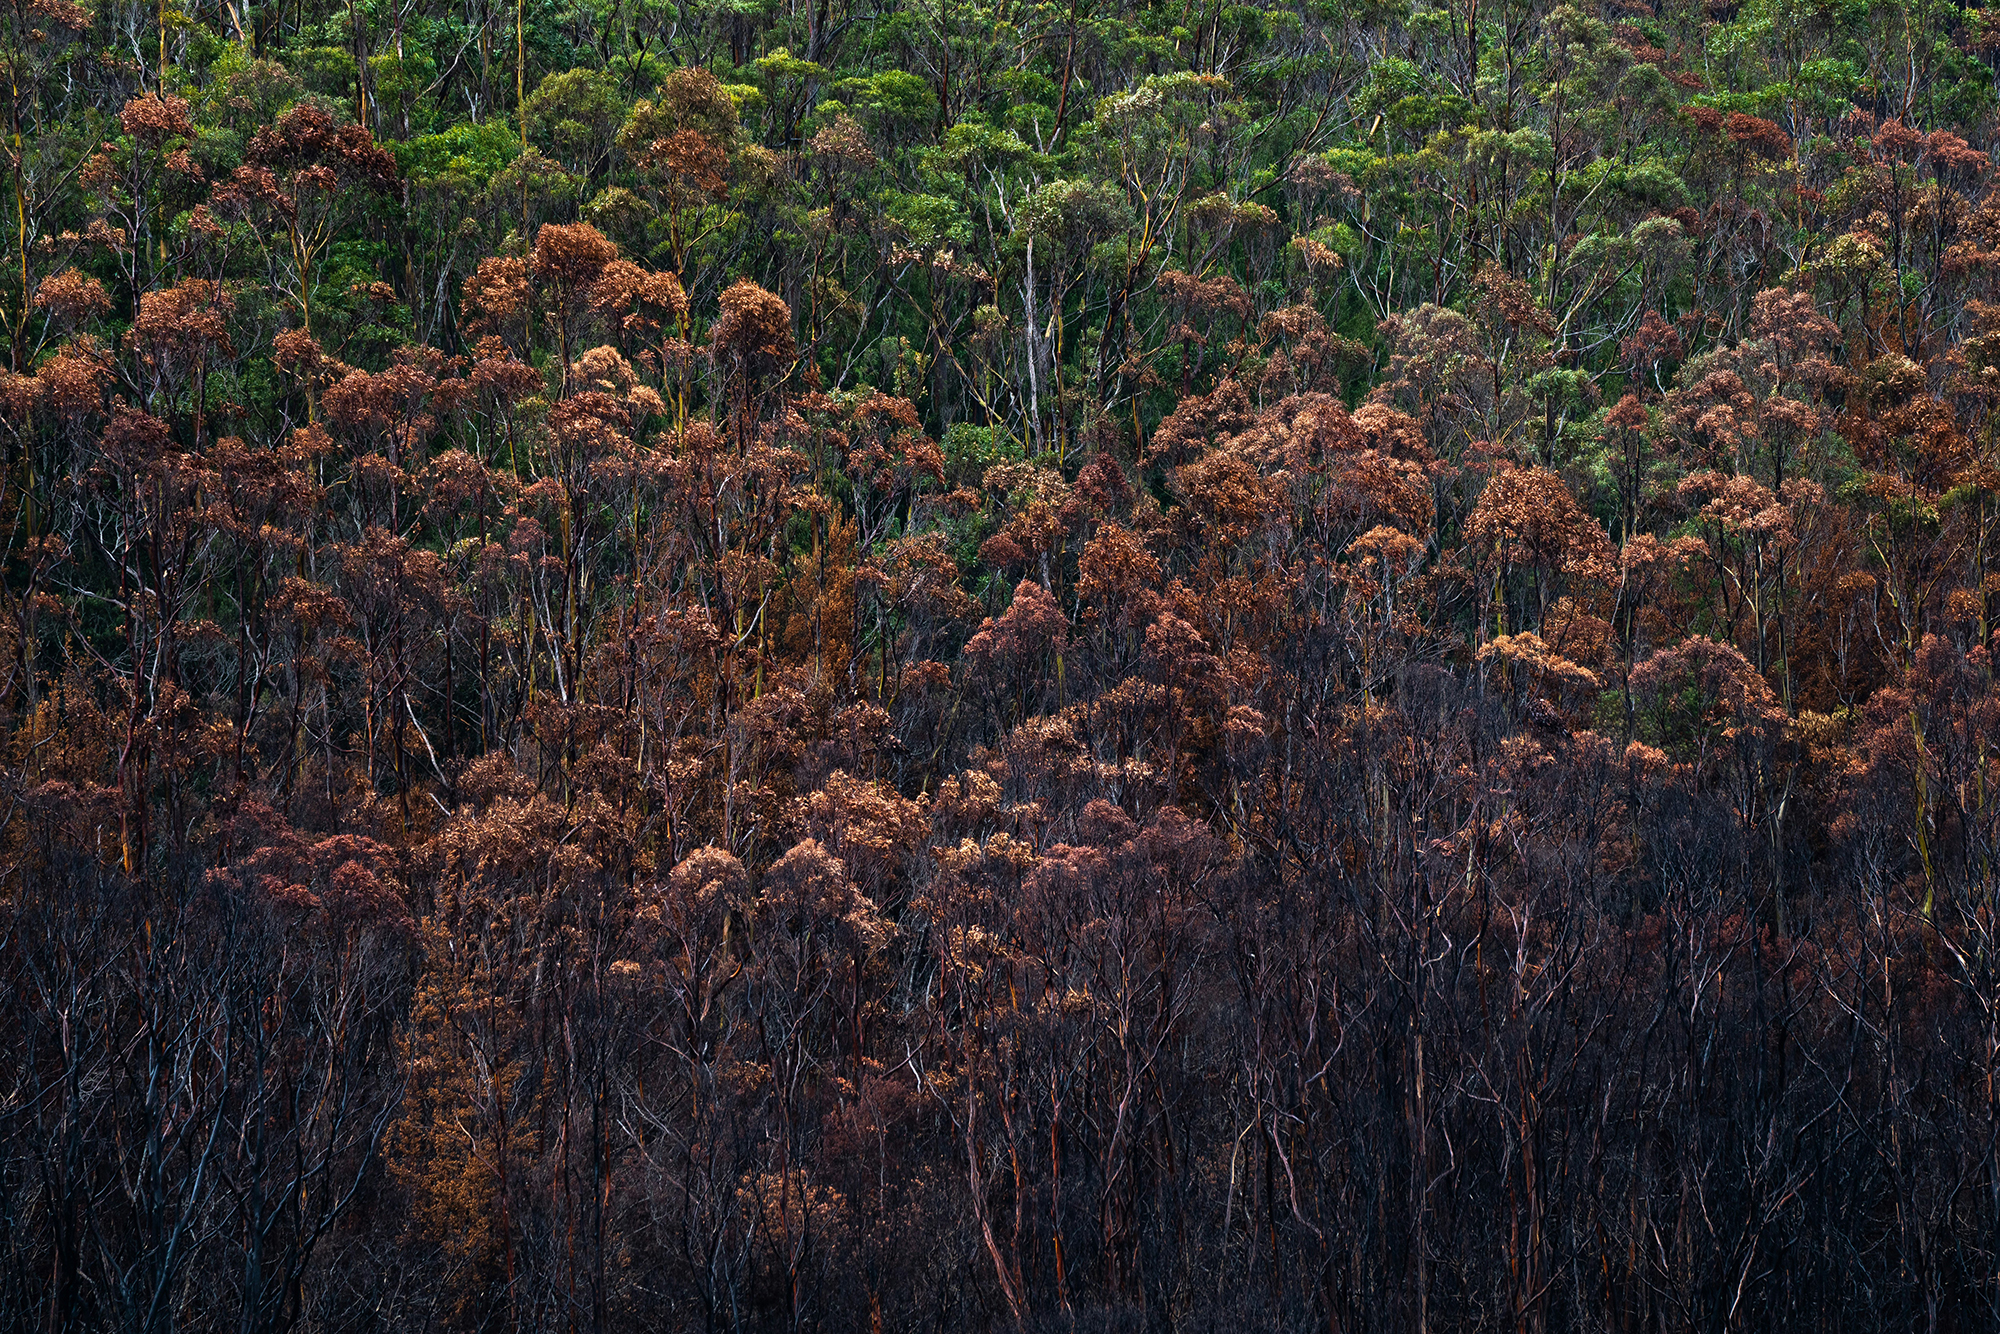
As autumn drew near, scientists became increasingly confident that the upcoming winter would be characterized by a particularly strong El Niño event. And though the El Niño period we’re in is natural and relatively predictable, its impacts on the global environment and economy have been significant — from sweltering heat in Australia to deep freezes across the southern U.S.

In fact, El Niño may be giving us a glimpse of what’s to come if climate change is not soon curtailed.

How El Niño loads the meteorological dice

Spanning the width of the tropical Pacific Ocean, roughly from Indonesia to Ecuador, is a vast area of water that influences weather and climate all across the planet. While it may look small on a map, this region reaches halfway around the circumference of the Earth — and what happens there is responsible for impacts that range from heavy rains in California to raging wildfires in Australia.

Scientists monitor this area closely, using arrays of buoys and satellites to keep tabs on its oceanic and atmospheric activity. Each year, they use these data to forecast the conditions — El Niño, La Niña or neutral — that will define the coming seasons.

Sea surface temperatures in the tropical Pacific vary significantly between El Niño (warm) and La Niña (cool) years.

El Niño and its counterparts make up the seasonal climate pattern known as El Niño Southern Oscillation, or ENSO (pronounced “en-so”). Sea surface temperatures in the tropical Pacific vary between warmer than average (El Niño), cooler than average (La Niña) or roughly average (neutral). El Niño tends to arrive every two to seven years, and typically lasts for less than a year.

Nick Bond

Washington State Climatologist

Bond serves as Washington State Climatologist and is a senior research scientist with the UW’s Cooperative Institute for Climate, Ocean, and Ecosystem Studies. His research areas include the weather and climate of the Pacific Northwest and the linkages between the climate and marine ecosystems of the North Pacific.

Learn more

“ENSO is one of, if not the single most important source of weather and climate predictability on seasonal timescales,” said Nick Bond, Washington State Climatologist and senior research scientist with the UW’s Cooperative Institute for Climate, Ocean, and Ecosystem Studies. “It doesn’t dictate the weather from day to day, but it loads the dice in favor of certain conditions across the globe.”

Each ENSO condition carries with it significant implications for global weather and climate:

  • El Niño is when the tropical Pacific is warmer than average. The trade winds, which blow consistently east to west along the equator, weaken or even reverse. Warm, wet air rises over the central and eastern Pacific, forming large storm clouds and increasing rainfall. On the other side of the ocean, Indonesia tends to experience dry conditions.
  • La Niña is the opposite, when the tropical Pacific is cooler than average. The east-to-west trade winds blow even harder than usual, resulting in less rain over the central and eastern Pacific and more rain over Indonesia to the west.
  • Neutral conditions are when the tropical Pacific is near average temperatures. This can also occur when sea surface temperatures are above or below average, but the trademark atmospheric effects of El Niño or La Niña haven’t kicked in.

This matters because each situation causes areas of high or low air pressure, temperature and moisture to move around, and even repositions the jet stream, leading to indirect impacts on weather far beyond the equator.

Karin Bumbaco

Deputy Washington State Climatologist

Bumbaco serves as the Deputy Washington State Climatologist and is a researcher in the UW’s Climate Impacts Group. Her research focuses on Washington weather and climate and includes a focus on heat waves and droughts.

Learn more

“There’s a shift in the location and intensity of these long-lasting thunderstorm clusters in the equatorial Pacific,” Bond said. “That sets up ripple effects and consequences for the weather in the higher latitudes.”

El Niño can also vary in strength. In December 2023, for example, temperature anomalies in the tropical Pacific reached 2.0 degrees C above average — right on the threshold between a “strong” and “historically strong” El Niño. But that doesn’t necessarily equate to stronger effects.

“There’s enough randomness involved that it’s always a mixed bag when you get an El Niño, even a strong one like this,” said Karin Bumbaco, Deputy Washington State Climatologist and researcher in the UW’s Climate Impacts Group. “We’ve only had three very strong El Niño events on record, and they have not always been in line with our expectations.”

That variability is part of what makes El Niño so disruptive. But it does tend to follow certain patterns, all of which add up to dramatic changes across the planet.

El Niño’s impacts across the globe

El Niño — Spanish for “the boy” — was named in reference to the Christian nativity by South American fishers who noticed abnormally warm waters around Christmas every few years. For many, though, its arrival is far from a festive occasion.

“Starting in the tropical Pacific itself, El Niño tends to bring excessive rainfall and flooding to the South American coast in the region of Ecuador and Peru,” Bond said. “Normally, nutrient-rich water from deeper in the ocean is brought to the surface by the trade winds. When those winds weaken, the nutrients stay deep, and it can basically shut down one of the most productive fisheries on Earth.

people gather on the edge of a flooding canal to look at the turbulent water
Heavy rain caused flooding throughout Santa Fe Province, Argentina in April 2023.

“On the other side of the ocean, dry conditions in Indonesia are often responsible for tropical forest fires, and that lack of rain can be widespread across southern Asia. India’s monsoons normally provide important water for agriculture, but during El Niño they’re suppressed, and can lead to significant drought.”

El Niño creates stark contrasts across the globe. It typically brings flooding to Ethiopia and drought to southern Africa. Northeast Brazil is dry, and Argentina gets drenched. California and the American Southwest often experience torrential rains thanks to a southern-shifted jet stream, and in turn, the Pacific Northwest is warmer and drier, reducing the snowpack that’s crucial for feeding rivers and filling reservoirs in the bone-dry summer. Much of Australia is subject to bone-dry summers and major wildfires. There are mild winters in New England and frigid temperatures below the Mason-Dixon line.

Map showing impacts of El Niño across the globe with abnormally dry, wet, warm or cool weather.
National Weather Service
El Niño causes a cascade of abnormal weather patterns across the globe.

Just about everywhere, natural and human systems are forced to deal with too much water or too little, and sweltering heat or freezing cold where one would usually expect the opposite.

These conditions are more than just an inconvenience. In much of the world, their impacts can be devastating to ecosystems and human health.

“Excessive rains in South America, for example, can impact urban water supplies and sewage systems. Severe flooding from El Niño conditions has led to outbreaks of cholera and dysentery in the developing world,” McPhaden said. “On the economic side, too much or too little rain is bad for agriculture. When output drops, supply and demand kicks in and it affects prices. So if you eat rice, and the rice crops in Southeast Asia or Louisiana are impacted, you’re going to feel it even if there’s no direct El Niño impact where you live.”

A farmer herds cows between rice fields near Nam Định, Vietnam.

A recent study estimates the global economic losses from El Niño events are in the trillions of dollars, with negative effects that persist well into the following years. And while there are winners and losers — for example, the west coast of South America often sees more destructive cyclones, while the Caribbean and eastern United States tend to see quieter hurricane seasons — these events almost always represent a significant shift to the global status quo.

Naturally, this invites an important question: As human-caused climate change pushes global temperatures to rise, are El Niño events getting worse?

Climate change and El Niño

An important detail to note about El Niño and La Niña is that they are measured against a rolling average of sea-surface temperatures. That means that when researchers say the tropical Pacific is 2 degrees C warmer than normal, they mean 2 degrees C warmer than the average from 1991-2020 — a period that was already significantly warmer than pre-industrial times. The actual sea surface temperatures may well be record-setting, even if the El Niño event itself is not.

This is one contributing factor to those off-the-charts ocean temperatures we saw in 2023. But El Niño plays another important role in how we measure — and experience — global warming.

“If you look at a chart of global average surface temperatures over time, you’ll see a steady rise due to increasing greenhouse gas concentrations in the atmosphere, but then you see ups and downs every few years,” McPhaden said. “The ups are El Niño and the downs are La Niña.”

Monthly sea surface temperature, El Niño
NOAA
El Niño and La Niña are measured against a rolling average of sea surface temperatures, which shifts over time due to climate change.

In La Niña years, the surface of the Pacific Ocean is cool and the skies above it are relatively clear, which allows the ocean to absorb lots of heat directly from sunlight. In El Niño years, the ocean instead releases a massive amount of that heat back into the atmosphere, causing a spike in global temperatures.

From 2020 to 2023, the Pacific saw three La Niña years in a row — known in scientific circles as a rare “triple dip” — allowing the ocean to suck heat out of the atmosphere and store it beneath the surface.

“Now that we have an El Niño, that heat is being released and redistributed around the globe by atmospheric circulation,” McPhaden said. “We’re seeing record temperatures in the ocean and heatwaves on land as well. The previous La Niña period was effectively masking the impact of rising greenhouse gas concentrations.”

In other words, the impacts we’ve seen this winter are a more accurate reflection of global warming’s true extent than we’ve seen in previous years. But as climate change continues to take its toll, should we expect to see this kind of thing more often?

“ENSO exhibits a tremendous amount of natural variability on its own, even with no changes in greenhouse gas concentrations,” McPhaden said. “But based on the latest assessment of our climate models, you could make an argument that the ENSO cycle from 1960 to the present has been more energetic than it was in the previous 60 years. The difference is only about 10%, but that 10% means that the biggest and strongest ENSO events are getting stronger.”

A wall of trees with the bottom half of the canopy browned and burnt
Wet forests act as natural fire barriers in Tasmania, but drought in El Niño years can make them susceptible to burning.

There is still no consensus in the scientific community about whether climate change will impact the frequency of El Niño or La Niña events. And further, the strongest events don’t always amplify their effects in obvious ways. But what is clear is that Earth’s oceans and atmosphere are entering unprecedented territory.

It is perhaps fitting that El Niño and La Niña remain enigmas in the realm of climate science. They are immensely complex systems that touch nearly every corner of our planet, and in some ways seem to serve almost as microcosms of the Earth itself. They are powerful and unpredictable, capable of turning the global economy on its head in the course of just a few months. But they are also sensitive to the same human impacts that are reshaping our ecosystems and the very nature of our atmosphere.

As our predictive tools improve, it is likely that we will gain a clearer picture of how ENSO will evolve in the decades to come. In the meantime, these phenomena are a potent reminder of just how much we still have to learn about our world — and just how quickly things can change.


Story by Will Shenton