Many people are now aware of climate change, the need to curb greenhouse gases and to prepare for coming environmental shifts. But knowing how best to prepare can be a challenge, both for individuals and for local agencies.
The University of Washington’s Climate Impacts Group has released an interactive tool that lets state agencies and local governments see what climate scientists project for their county and what they might want to consider when developing their districts’ comprehensive plans.
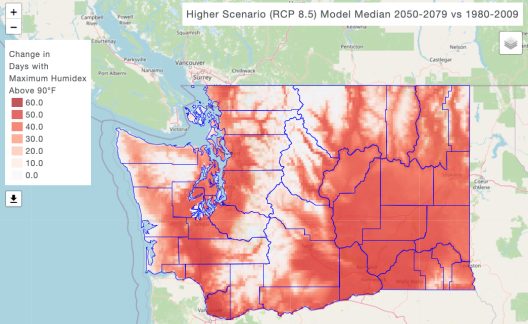
The Climate Mapping for a Resilient Washington tool, released in late 2022, lets users zoom in to their county to see projections for heat, drought, extreme precipitation, flooding, wildfire, sea level rise and reduced snowpack through 2100.
UW News sat down with developer Matt Rogers, a research scientist at the UW Climate Impacts Group, to learn more about the new tool and its uses.
Read more at UW News »